
CALL 0115 647 0111
Case study: vehicle accessories retailer · Google Ads
A Google Ads case study. An online retailer of roof racks, side bars and styling parts grew its Google Ads sales and cut the cost of each one. Every figure is from the client's own Google Ads account.
About the client
The business sells vehicle accessories online, from roof racks and side bars to styling parts for cars, SUVs, vans and pickups, with delivery across the UK. Its Google Ads account is on our Elite package.
We publish a client's name only with their written permission, so this case describes the business by its sector and region. The results are from its own Google Ads account.
What we did
Our team manages the account as part of our Elite package, with a named account manager.
The results
We compared its first three months with us (November 2025 to January 2026) against June to August 2026.
How we worked this out
Every figure compares the account's online purchase conversion, which counted in both periods. Figures are Google Ads' own, read from the client's account in October 2026, so the client sees the same numbers in their account.
Winter months against summer months, so some of the change is season. The cost of each sale fell while spend rose, which season does not explain.
We show changes as percentages and multiples only. The client's own numbers, such as spend and sales, stay private.
More results
Other businesses whose Google Ads we manage, measured the same way.
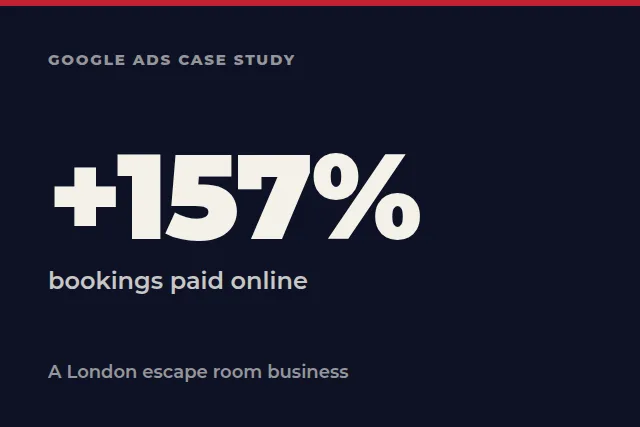
157% more bookings paid online.
Google Ads, online bookings
A London escape room ran its own Google Ads before joining us. Online bookings from the ads more than doubled.
Read the case study: A London escape room business
4.1x the online sales from Google Ads.
Google Ads, online sales
An online sportswear retailer selling to UK shoppers quadrupled its Google Ads sales within months of joining us.
Read the case study: An online sportswear retailer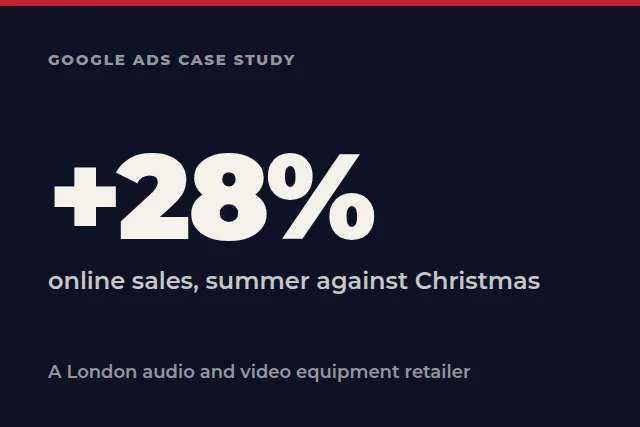
28% more online sales than its Christmas quarter before us.
Google Ads, online sales
A specialist audio and video equipment supplier sold more through Google Ads in summer than in the Christmas quarter before it joined us.
Read the case study: A London audio and video equipment retailerCase study FAQs
We publish a client's name only with their written permission. Until then we describe the business by its sector and region. The figures are from its own Google Ads account either way.
We compared its first three months with us (November 2025 to January 2026) against June to August 2026, using the account's online purchase conversion, which counted in both periods. We show percentages and multiples only, so the client's own numbers stay private.
No. No marketing strategy can guarantee results, and we say so before you sign up. Every business starts from a different place, so this is an example of what happened, not a promise.
Get started
The quickest way is a call. Tell us about your business and what you want from your marketing, and we will tell you honestly where we would start and what it would cost.
Call our UK team0115 647 0111